Introduction
Past research has shown that endocrine-disrupting compounds (EDCs), including steroid hormones, synthetic estrogens, and progestins found in oral contraceptives, are present in water supplies 1,2. This problem remains an environmental and health concern, especially given the widespread use of contraceptives 3 and the increased prevalence of medication abortion in recent years 4. These compounds have a number of deleterious effects on human and animal biology, particularly aquatic animals 5,6,7,8,9,10. Small amounts of these chemicals (parts per trillion) can affect the endocrine system of animals and humans 10. Progestins, including specifically the anti-progesterone synthetic steroid hormone mifepristone, have been found to have disruptive effects on the fertility and reproduction of fish 6,7. Moreover, further highlighting the potential for environmental toxicity and contamination, the FDA recommends treating any unused mifepristone pills as hazardous waste 11.
Removal from the water supply of EDCs, including estrogens, progesterone, and other steroids, by either basic wastewater treatment or basic drinking water treatment, has proved to be problematic 12,13,14,15,16,17, though recently hybrid water treatment methods have shown more promise, especially those including both reverse osmosis and activated carbon filters 12,14,17.
Abortion providers have shifted a large part of their practice from surgical to chemical (medication-induced) abortion. In 2023, 642,700 of the abortions in the US were medication abortions, forming 63% of the total 4. The first drug given in this type of abortion is the anti-progesterone synthetic steroid hormone mifepristone, or RU-486. Mifepristone is an antagonist of progestational and glucocorticoid hormones. Mifepristone competitively binds to the progesterone receptor, thereby inhibiting the effects of endogenous or exogenous progesterone 18,19,20,21. The drug is thought to disrupt attachment of the placenta to the uterine lining in early pregnancy 20,22,23. The prostaglandin-like drug misoprostol is administered several days later to induce uterine contractions and preterm labor 24.
The increased use of the anti-progesterone hormone mifepristone indicates it might be present in water supplies. Given the potential negative impacts of mifepristone on the environment, human and animal health, and the lack of studies addressing these issues, we sought to investigate the presence of unmetabolized mifepristone in water supplies at three sites in the United States. Cities with moderate populations of women of childbearing age were selected for this initial testing. A statistically significant amount of anti-progesterone activity was found in all but one of the nine water sources.
Materials and Methods
We collected 4 water samples from 3 sites upstream of water treatment facilities; 4 water samples from 3 sites downstream of water treatment facilities; and 4 samples from municipal tap water in each of 3 American cities: Austin, Texas; Blacksburg, Virginia; and Carbondale, Illinois. The water in the upstream locations does not contain untreated sewage. In all 3 cities, municipal sewage water is routed directly to the water treatment facilities and then discharged into environmental waters after treatment. Municipal drinking water comes from surface waters, not from groundwater wells 25,26,27,28. For each location, water treatment facilities located within the area of highest population density and/or treating wastewater from a university were chosen. Each sampling location was chosen based on accessibility and proximity to the discharge location of the water treatment facilities.
Sample bottles were prepared by ALS Environmental in Cincinnati, Ohio, for analysis of anti-progesterone CALUX®. Samples were collected utilizing grab sample techniques. Each city also contained a “field blank” sample filled with laboratory-supplied distilled water. All samples were shipped to SafeBridge Regulatory & Life Sciences Group overnight for next-day delivery. The water samples were sent blind (without source identification) to the BioDetection Systems laboratory in the Netherlands, which dissolved the samples in DMSO and used PR CALUX® bioassays to test for mifepristone and anti-progesterone activity 29. The PR CALUX® activity was determined after 24 h exposure and benchmarked against mifepristone (Ru486). Briefly, optimized solid-phase extraction (SPE) was applied to extract water samples. The enriched extract, containing a mixture of compounds, was exposed to genetically modified cell lines in CALUX® bioassays. Firefly luciferase gene, coupled with responsive elements (REs) such as reporter genes, is incorporated into the DNA of these cell lines. The presence of an appropriate substrate, in this case mifepristone, triggers the activation of such REs, thus initiating the creation of luciferase, which then emits light. The amount of light produced is measured by a luminometer and is proportional to the amount of ligand-specific receptor binding, which is benchmarked against a reference level of mifepristone.
Statistical Analysis
For the purpose of the analysis, values that were below the detectable threshold were considered as zero (0). We calculated the t-test statistic as follows:
t-test statistic = observed value – expected value (control)
population standard deviation (σx)
For the t-test of statistical significance, differences were considered significant at p < 0.05. While not considered significant, p-values within the range of 0.05 < p < 0.1 indicate a tendency towards significance. The results of that analysis are included in Tables 1 and 2 and in Appendix A.
To be more rigorous, we asked Dr. Michael New to recommend a non-parametric statistical test that would not rely on the assumption of a normal distribution among the findings. We used Dr. Michael New’s method to perform an analysis based on the straight probability of rankings. The results of that analysis are included in Tables 1 and 2 and in Appendix B.
Results
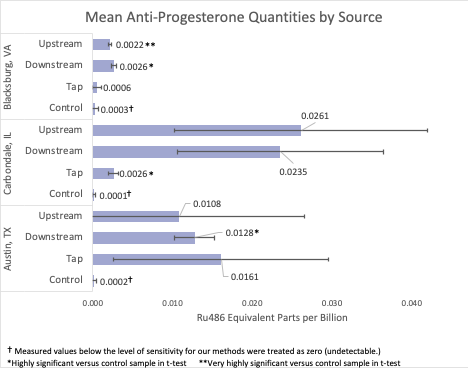
Results are given in Table 1, RU486 equivalent concentration vs. controls, t-test and ranked test; Table 2, Differences in RU486 equivalent concentration between water sources, t-test and ranked test; and Figure 1, RU486 equivalent concentration vs. controls, below.
Table 1. RU486 equivalent concentration vs. controls, t-test and ranked test.
| City | Water Source | Conc | t-test P | t-test S | Ranked test P | Ranked test S |
| Blacksburg VA | ||||||
| Upstream | 0.0022 | p < 0.0005 | very highly significant | 0.0143 p < 0.05 | significant | |
| Downstream | 0.0026 | p < 0.005 | highly significant | 0.0143 p < 0.05 | significant | |
| Tap | 0.0006 | p > .20 | not significant | 0.2143 | not significant | |
| Control | 0.0003 | |||||
| Carbondale IL | ||||||
| Upstream | 0.0261 | >.10 | not significant | 0.0143 p < 0.05 | significant | |
| Downstream | 0.0235 | 0.05 < p < .10 | tending towards significance | 0.0143 p < 0.05 | significant | |
| Tap | 0.0026 | p <0.005 | highly significant | 0.0143 p < 0.05 | significant | |
| Control | 0.0001 | |||||
| Austin TX | ||||||
| Upstream | 0.0108 | p > .10 | not significant | .0119 p < 0.05 | significant | |
| Downstream | 0.0128 | p < 0.025 | highly significant | .0079 p < 0.01 | highly significant | |
| Tap | 0.0161 | p > .10 | not significant | .0079 p < 0.01 | highly significant | |
| Control | 0.0002 | |||||
P = probability; S = significance; Conc = mean concentration of anti-progesterone (Ru486 equivalent), μgram/l
Table 2. Differences in RU486 equivalent concentration between water sources, t-test and ranked test.
| City | Water Sources | % change | t-test P | t-test S | Ranked test P | Ranked test S |
| Blacksburg VA | ||||||
| U-D | 27.9↑ | <0.005 | highly significant | 0.0428 p < 0.05 | significant | |
| U-T | 38.1%↓ | <0.0005 | very highly significant | 0.0143 p < 0.05 | significant | |
| D-T | 51.9%↓ | <0.005 | highly significant | 0.0143 p < 0.05 | significant | |
| Carbondale IL | ||||||
| U-D | 13.8%↓ | >.10 | not significant | .5 | not significant | |
| U-T | 90.0%↓ | <0.0005 | very highly significant | 0.0716 0.05 < p < .10 | tending towards significance | |
| D-T | 88.9%↓ | <0.0005 | very highly significant | 0.0571 0.05 < p < .10 | tending towards significance | |
| Austin TX | ||||||
| U-D | 45.1%↓ | >.10 | not significant | 0.0716 0.05 < p < .10 | tending towards significance | |
| U-T | 2.9%↓ | >.10 | not significant | .22 | not significant | |
| D-T | 77%↑ | >.10 | not significant | .5 | not significant | |
U = upstream; D = downstream; T = tap; P = probability; S = significance.
Figure 1. RU486 equivalent concentration vs. controls.
Blacksburg
These statistics indicate that upstream and downstream differ significantly from each other and from both controls. The amount of RU486 equivalent in these environmental water sources is significantly greater than in the controls by the t-test (p < .005 or lower) and by the ranking test. The tap water here appears significantly cleaner than the water from the environment. Two of the four tap samples were below our levels of detection.
Carbondale
These statistics indicate that upstream and downstream differ significantly from both controls but not from each other. The tap water here is significantly cleaner than both sources of environmental water but contains a significantly greater amount of the contaminant than the controls, as indicated by the t-test (p > 0.025) and the ranking test.
Austin
The downstream samples have significantly more of the contaminant than the controls, as indicated by both the t-test (p > 0.025) and the ranking test. Neither upstream nor tap water differs significantly from the controls by the t-test due to the large standard deviation in the measurements. The tap water in the Austin area may contain higher levels of RU486 equivalent than the downstream water, but the t-test does not indicate a significant difference because of the large standard deviation in the tap water measurements. However, samples from both the upstream and tap water differ significantly from the controls according to the ranking test.
Water Treatment
The upstream locations should not be considered as water containing untreated sewage. In all 3 cities, sewage water is routed directly to the water treatment facilities and then discharged to environmental water after treatment 25,26,27,28. In all 3 cities, the level of RU486 equivalent in downstream water sources is not appreciably lower than in upstream water sources; in fact, in two of the cities it is higher. This may be expected. Untreated sewage may not be present in upstream samples, but above-ground streams could become contaminated by nearby sewage lines if the lines are damaged by frost heaving or other environmental disruptions. On the other hand, treated sewage water is expected to be included in the downstream samples. At any rate, water treatment was ineffective at removing this EDC. This downstream-treated environmental water is not equivalent to household tap water, which was tested by a different group.
Discussion
The presence of mifepristone, or it’s biologically active metabolites in environmental water could affect wildlife and even human health. Antiprogesterone compounds could affect the reproductive and other physiological functions of aquatic animals, such as fish and amphibians 5,6,7,8,9,11,12, and farm animals 10. Steroid hormones have even been shown to negatively affect root growth in plants 11. Mifepristone is considered by one manufacturer, Fass, to have “low potential for bioaccumulation” in fish, but “very high chronic toxicity”, though Fass admits that both these claims are comparative rather than quantitative. Up to 10% of mifepristone remains in sediment after 239 days 30.
We do not know how long mifepristone remains in women’s tissues or whether it bioaccumulates. We could find no studies on the levels of this hormone in human tissues such as liver or fat cells, either in the short term or over time with bioaccumulation. In a study of only 5 women, the half-life of mifepristone in serum varied from 24 to 44 hours 31, but serum is an aqueous milieu. The serum level is not the same as the tissue level, which was not measured in that study. Mifepristone is a steroid hormone and therefore a fat-soluble molecule. Such a molecule might build up in fatty tissues rather than remain in the aqueous serum and be excreted. Further study of this possibility is warranted.
Steroid hormones have systemic effects on every cell in the body. Progesterone has numerous known effects 18,19. Its role in maintaining pregnancy by supporting placental attachment is well-known, but it is also involved in many other systems. An anti-progesterone such as mifepristone could inhibit any actions of normal progesterone, particularly on pregnant women, but also on pre- or post-menopausal women. The presence of an anti-progesterone in the water supply could also render previously effective clinical dosages of progesterone inadequate, because the anti-progesterone antagonizes progesterone by binding to its receptor.
Long-term use of low-dose mifepristone has been found to cause changes in the endometrium, including atypical thickening, the presence of carcinoma-like tissues 21, and to suppress ovulation and menstruation 32. Low doses of mifepristone have also been shown to lead to amenorrhea 33. Moreover, questions about the impact of such chemicals on maternal health and linkages to autism warrant further study 34. Low progesterone levels in pre-menopausal, menstruating women have been associated with multiple health problems including lower fertility rates, higher rates of miscarriage, and higher rates of other medical complications during pregnancy 35,36,37,8.
Mifepristone could even inhibit some actions of progesterone on men, who normally have small amounts of progesterone in their bodies. Low progesterone levels in men have been associated with multiple medical problems including alopecia, bone loss, erectile dysfunction, fatigue, and obesity 18.
Unmetabolized mifepristone or it’s metabolites could be present in the tested waters for several reasons. We have no data on the sources of mifepristone in the water, nor can we scientifically rank their likelihood. Given the high number of chemical abortions (642,700 medication abortions in the US in 2023 4), the most probable source is fecal and urinary excretion by women ingesting mifepristone for chemical abortion. Clearance from the body was mainly through feces (83%) 39. The standard dose of 200 mg may be excessive for some women. Alternatively, mifepristone or it’s metabolites could enter the water from feces or urine of patients taking the medication for reasons other than abortion. One of the other conditions for which mifepristone is prescribed is Cushing’s Syndrome or Cushing’s Disease 40. Fewer than 20,000 Americans are estimated to have a diagnosis of Cushing’s 41, so this is a far less likely contributor. Mifepristone is also sometimes prescribed for endometriosis, meningioma, and mental illness 21, but these are also far less common uses. Other sources could be improper disposal of any unused product by the patient or manufacturer. Considering the regulations governing pharmaceutical manufacturing, the latter seems very improbable.
Another molecule with anti-progesterone activity could have triggered the REs (Responsive Elements) of the CALUX system and produced a luminescent response. Women who take the drug would be very likely to excrete metabolites of mifepristone as well as the intact compound. The 5 metabolites of mifepristone, including the 3 most common: metapristone (monodemethylated mifepristone), didemethylated mifepristone, and 22-OH mifepristone 42,43 are pharmacologically active, able to bind to human progesterone and glucocorticoid receptors, and therefore should be regarded as significant environmental pollutants 43,44. In the event that a metabolite of mifepristone or any other chemical did bind to the REs of the CALUX system and show a positive response, that molecule would have anti-progesterone effects and should be considered harmful and undesirable in our water supply. Future studies should investigate whether water samples contain these compounds.
Conventional water treatment was ineffective at removing this EDC from water across all cities we tested. Two cities showed significant mean concentrations even in tap water. Conventional treatment systems are primarily designed to remove infectious agents such as bacteria and viruses, with secondary treatment, according to the US Environmental Protection Agency, required to address hormones (49-99% removal) 45. Maximum removal requires tertiary treatment, such as membrane bioreactors, oxidation, or ozonation 1,2,12,13,14,15,16,17,45.
Further investigation is necessary to better understand the impact of any levels of mifepristone or other anti-progesterone activity in the environment and the efficacy of its removal by treatment systems. Concerns about the environmental, clinical and public health impact of mifepristone raise urgent questions about the current lack of meaningful regulation of this widely-used pharmaceutical.
Abbreviations
The following abbreviations are used in this manuscript:
EDC = endocrine-disrupting compound
Ru486 = mifepristone
DMSO = dimethyl sulfoxide
SPE = solid-phase extraction
RE = responsive element
FDA = Food and Drug Administration
CALUX = chemical-activated luciferase expression
The following abbreviations are used in the tables:
Conc = concentration of anti-progesterone (Ru486 equivalent), μgram/l σx=Population Standard Deviation
P = probability
t test statistic =observed value-expected value (control)/σx
S = significance
* = below the detection limit (level of sensitivity) for our methods; considered as 0 for statistical calculations.
Appendix A
Table 3. RU486 equivalent concentration vs. controls, t-test.
| State | Water Source | Conc | Mean Conc | (σx) | t-test statistic | t-test P | t-test S |
|---|---|---|---|---|---|---|---|
| All | Lab control | * | |||||
| Lab control | * | ||||||
| .0000 | |||||||
| VA | Upstream | .0023 | |||||
| Upstream | .0023 | ||||||
| Upstream | .0019 | ||||||
| Upstream | .0021 | ||||||
| .0022 | 0.0002 | 12.952 | p < 0.0005 | very highly significant | |||
| Downstream | .0024 | ||||||
| Downstream | .0031 | ||||||
| Downstream | .0027 | ||||||
| Downstream | .0023 | ||||||
| .0026 | 0.0003 | 8.467 | p < 0.005 | highly significant | |||
| Tap | .0011 | ||||||
| Tap | .0013 | ||||||
| Tap | * | ||||||
| Tap | * | ||||||
| .0006 | 0.0006 | 1.0 | p > .20 | not significant | |||
| Field blank | .0010 | ||||||
| Field blank | * | ||||||
| .0005 | |||||||
| IL | Upstream | .0014 | |||||
| Upstream | .0390 | ||||||
| Upstream | .0410 | ||||||
| Upstream | .023 | ||||||
| .0261 | 0.0159 | 1.642 | >.10 | not significant | |||
| Downstream | .0019 | ||||||
| Downstream | .0270 | ||||||
| Downstream | .0360 | ||||||
| Downstream | .0290 | ||||||
| .0235 | 0.0129 | 1.822 | 0.05 < p < .10 | Tending towards significance | |||
| Tap | .0024 | ||||||
| Tap | .0035 | ||||||
| Tap | .0018 | ||||||
| Tap | .0027 | ||||||
| .0026 | 0.0006 | 4.262 | p < 0.005 | highly significant | |||
| Field blank | .0004 | ||||||
| Field blank | * | ||||||
| .0002 | |||||||
| TX | Upstream | .0022 | |||||
| Upstream | .0380 | ||||||
| Upstream | .0031 | ||||||
| Upstream | * | ||||||
| .0108 | 0.0157 | 0.687 | p > .10 | not significant | |||
| Downstream | .0170 | ||||||
| Downstream | .0120 | ||||||
| Downstream | .0110 | ||||||
| Downstream | .0110 | ||||||
| .0128 | 0.0025 | 5.12 | p < 0.025 | significant | |||
| Tap | .0046 | ||||||
| Tap | .0390 | ||||||
| Tap | .0120 | ||||||
| Tap | .0089 | ||||||
| .0161 | 0.0122 | 1.193 | p > .10 | not significant | |||
| Field blank | .0008 | ||||||
| Field blank | * | ||||||
| Field blank | * | ||||||
| .0003 |
Conc = concentration of anti-progesterone (Ru486 equivalent), μgram/l; σx = Population Standard Deviation, P = probability; t test statistic =observed value-expected value (control)/σx; S = significance; * = below detection limit for our methods (<0.00096 Ru486 equivalent ug/l); considered as 0 for statistical calculations.
Appendix B
Probability Based on Ranking Method (non-parametric test)
Modified by Elise Rose with additional data using a probability method based on ranking devised by Dr. Michael New.
Summary: Water samples were taken from three cities, Blacksburg, VA, Carbondale, IL, and Austin, TX to measure and compare the amount of anti-progesterone. For each city, six comparisons were made, for a total of 18 comparisons:
1) Between upstream and controls
2) Between downstream and controls
3) Between tap water and controls
4) Between upstream and downstream
5) Between upstream and tap water
6) Between downstream and tap water
Using a non-parametric test, differences in 13 of the 18 comparisons were statistically significant at conventional levels. Importantly, 8 of the 9 comparisons involving control samples achieved conventional levels of statistical significance. That is, the probability was less than 5% that, due to random chance, the control samples were lower than the environmental or tap samples. In other words, we can be 95-99% confident that the environmental or tap samples had more mifepristone than the control samples. The fact that a supermajority of comparisons achieved conventional levels of statistical significance means that we can be statistically confident in the findings.
Blacksburg, VA (5 of 6 comparisons are statistically significant)
1) Upstream (4 Samples) vs. Control (4 Samples)
All four upstream samples report higher levels of anti-progesterone than all 4 control samples. The likelihood that both control samples would rank last is (4/8)*(3/7)*(2/6)*(1/5) = 1/70 = .01428. This achieves statistical significance at the 98% confidence level.
2) Downstream (4 Samples) vs. Control (4 Samples)
All four downstream samples report higher levels of anti-progesterone than all 4 control samples. The likelihood that both control samples would rank last is (4/8)*(3/7)*(2/6)*(1/5) = 1/70 = .01428. This achieves statistical significance at the 98% confidence level.
3) Tap water (4 Samples) vs. Control (4 Samples)
Two tap water samples report higher levels of anti-progesterone than all 4 control samples. Two tap water samples are largely indistinguishable from the control samples. The likelihood that all 4 control samples would rank in the bottom six of 8 samples would be (6/8)*(5/7)*(4/6)*(3/5) = .2143 This result is relatively unlikely, but does not reach conventional standards of statistical significance.
4) Upstream (Four Samples) vs. Tap water (Four Samples)
All four upstream samples report higher levels of anti-progesterone than the four tap water samples. The likelihood the four upstream samples would all rank in the top four would be (4/8)*(3/7)*(2/6)*(1/5) = 24/1680 = .01428. This is statistically significant at the 98% confidence level.
5) Downstream (Four Samples) vs. Tap water (Four Samples)
All four downstream samples report higher levels of anti-progesterone than the four tap water samples. The likelihood the downstream samples would all rank in the top four would be (4/8)*(3/7)*(2/6)*(1/5)= 24/1680 = .01428. This is statistically significant at the 98% confidence level.
6) Upstream (Four Samples) vs. Downstream (Four Samples)
Analyzing and interpreting these findings is more complicated. The three highest anti-progesterone levels all come from downstream samples. Then there are three samples that are tied (two upstream and one downstream). The two lowest come from downstream samples. The likelihood that the four upstream samples would rank (1, 2, 3, 4), (1, 2, 3, 5) or (1, 2, 3, 6) is: (4/8)*(3/7)*(2/6)*(1/5) + (4/8)*(3/7)*(2/6)*(4/5)*(1/4) + (4/8)*(3/7)*(2/6)*(4/5)*(3/4)*(1/3) .01428 + .01428 + .1428 = .0428. This is statistically significant at the 95% level.
Carbondale, IL (5 of 6 comparisons are statistically significant)
1) Upstream (4 Samples) vs. Control (4 Samples)
All four upstream samples report higher levels of anti-progesterone than all 4 control samples. The likelihood that all 4 control samples would rank last is (4/8)*(3/7)*(2/6)*(1/5) = 1/70 = .01428. This achieves statistical significance at the 98% confidence level.
2) Downstream (4 Samples) vs. Control (4 Samples)
All four downstream samples report higher levels of anti-progesterone than all 4 control samples. The likelihood that all 4 control samples would rank last is (4/8)*(3/7)*(2/6)*(1/5) = 1/70 = .01428. This achieves statistical significance at the 98% confidence level.
3) Tap water (4 Samples) vs. Control (4 Samples)
All four tap water samples report higher levels of anti-progesterone than all 4 control samples. The likelihood that all 4 control samples would rank last is (4/8)*(3/7)*(2/6)*(1/5) = 1/70 = .01428. This achieves statistical significance at the 98% confidence level.
4) Upstream (Four Samples) vs. Downstream (Four Samples)
The means here are close, .0261 vs. .0235. There is not much discernible grouping regarding how the samples are ranked. Thus there is no statistical evidence that there is a difference between the two means.
5) Upstream (Four Samples) vs. Tap Water (Four Samples)
Three upstream samples have the highest level of anti-progesterone. The fourth upstream sample has the lowest. The likelihood of the three upstream samples being the highest is (4/8)*(3/7)*(2/6) = .0716. This achieves statistical significance at the 90% level.
6) Downstream (Four Samples) vs. Tap Water (Four Samples)
Three upstream samples have the highest level of anti-progesterone. The fourth upstream sample has the second lowest. The likelihood of the three upstream samples being the highest and the fourth not being the lowest is (4/8)*(3/7)*(2/6)*(4/5) = .0571. This achieves statistical significance at the 90% level, and approaches the 95% level.
Austin, TX (4 of 6 comparisons are statistically significant)
1) Upstream (4 Samples) vs. Control (5 Samples)
The three samples with the highest level of anti-progesterone all come from upstream. The fourth upstream sample equals the lowest observed concentration. The likelihood that the three samples with the highest level of anti-progesterone would come from upstream is (3/9)*(2/8)*(1/7) = .0119. This achieves statistical significance at the 98% confidence level.
2) Downstream (4 Samples) vs. Control (5 Samples)
All four downstream samples report higher levels of anti-progesterone than all 5 control samples. The likelihood that the 4 samples with the highest level of anti progesterone would come from downstream is (4/9)*(3/8)*(2/7)*(1/6) = .0079. The likelihood that all 5 control samples would rank last is the same. This achieves statistical significance at the 99% confidence level.
3) Tap water (4 Samples) vs. Control (5 Samples)
All four tap water samples report higher levels of anti-progesterone than all 5 control samples. The likelihood that all 5 control samples would rank last is (5/9)*(4/8)*(3/7)*(2/6)*(1/5) = .0079. This achieves statistical significance at the 99% confidence level.
4) Upstream (Four Samples) vs. Downstream (Four Samples)
Three upstream samples have the highest level of anti-progesterone. The fourth upstream sample has the lowest. The likelihood of the three upstream samples being the three highest is (4/8)*(3/7)*(2/6) = .0716. This achieves statistical significance at the 90% level.
5) Tap water (Four Samples) vs. Downstream (Four Samples)
The mean levels of anti-progesterone are close here (.0161 vs. .01275). There does not appear to be much clustering in the ranking of samples. This indicates no statistically significant differences.
6) Tap water (Four Samples) vs. Upstream (Four Samples)
Three of the four samples with the highest level of anti-progesterone come from upstream as does the sample with the lowest level of anti-progesterone. The likelihood that three of the four highest anti-progesterone levels would come from upstream is about 22%. While this is unlikely, it does not reach conventional standards of statistical significance.
Acknowledgments
The authors wish to thank Dr. Michael New and Dr. Stephen Sammut for helpful discussions; Dr. New for devising the non-parametric statistical analysis based on ranking and straight probability contained in Appendix B; and Jilana Cotter for providing the data visualization. Dr. Varveris, Dr. New, Dr. Sammut, and Ms. Cotter were not compensated for their contributions.